Recently I was invited to participate in the California Data Camp and DataSF App Contest hosted by California Watch and spot.us. The unconference would feature lots of discussion about making use of publicly available data sets to improve quality of life. The App Contest challenged developers to choose one of the many data sets available at DataSF.org and build something cool with it in a relatively short period of time. Here’s a showcase of existing apps built on those data sets.
The Knight Digital Media Center (where I work) invited me to take part, and I chose a database of 64,000 San Francisco trees and plants. The goal of the project was to:
- Make it easy for citizens to explore and discover the huge number of plant species and individual trees maintained by the city
- Make it easy for citizens to “flag” a tree as needing maintenance, water, food, etc.
- Make it easy for citizens to request a tree at a particular location
- Provide data visualization tools to let citizens explore and understand the plant variety visually
- Make it easy to see what a given species will look like in 5,10,15,20 years when requesting a tree
- Ideally, a future version of the app would include ecology data on all species, listing the water consumption and carbon offset of each
I decided to build the project on Django, of course. Put a total of around 15 hours into the project, about half of which was spent massaging and cleaning the provided data, which had multiple pieces of information stuffed into single fields, non-standard date formats, and was completely non-relational. Cities implementing django-treedata “fresh,” without having to be compatible with an existing data entry system, won’t have to worry about data conversion/format issues.
Once the data was clean, the rest was pretty straightforward Django stuff. The one non-standard aspect is the external “lastcount” script, which counts the number of instances of each species and stores the result on a field in the Species model. Doing this in real time for such a large number of trees turned out to be very computationally expensive, so the script needs to be run from a crontab periodically.
Because dev time was so limited, all of it went into data cleaning and building out the models and views. We’ve put ZERO work into design considerations, so please don’t crucify us for that. The CSS is built on top of the excellent 960 Grid framework, so layout will be easy. Some of the data visualization is done via the excellent Google Charts API.
Much to our surprise, the django-treedata app won the competition!
Please note that the project has only been run in a development environment and has never been publicly deployed – the project as it stands should be considred a starting point for cities to built on. The readme explains more. The project is completely open source and is released under the very liberal BSD license – do with it as you will.
Thanks also to J-School webmaster for Chuck Harris for his contributions to the project
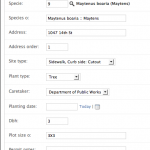
Screenshots
Download
django-treedata is available on Google Code, via svn.


Congrats!!
Thanks man! This is all your fault you know 🙂
Nicely done, congrats!!! thanks also for writing up the description! I would love to hear more about it since we’re working on a similar project here in NYC.
Pingback: Liveblogging from California Data Camp, App Contest | Spot Us - "Community Funded Reporting"
Pingback: Tanja Aitamurto: Sophisticated Tree Hugging: the Pure Joy of Public Data | News from: The Huffington Post - Breaking News and Opinion
Howdy! I simply wish to give an enormous thumbs up for the nice info you may have right here on this post. I will likely be coming back to your weblog for extra soon.
Howdy, i read your blog occasionally and i own a similar one and i was just curious if you get a lot of spam comments? If so how do you prevent it, any plugin or anything you can suggest? I get so much lately it’s driving me crazy so any help is very much appreciated.